
Reporting & Rapid Iteration
Measure, test, iterate — every week, not every quarter.
Set up my growth reportingWhy rapid iteration changes everything
Traditional marketing operates in long cycles: plan for 3 months, execute for 3 months, measure... and start over. Result: 6 months to discover a strategy doesn't work.
Our growth approach relies on one-week cycles. Every Monday, we analyze results. Every Friday, we've tested a new hypothesis. In 3 months, you've iterated 12 times — not once.
Our performance dashboards
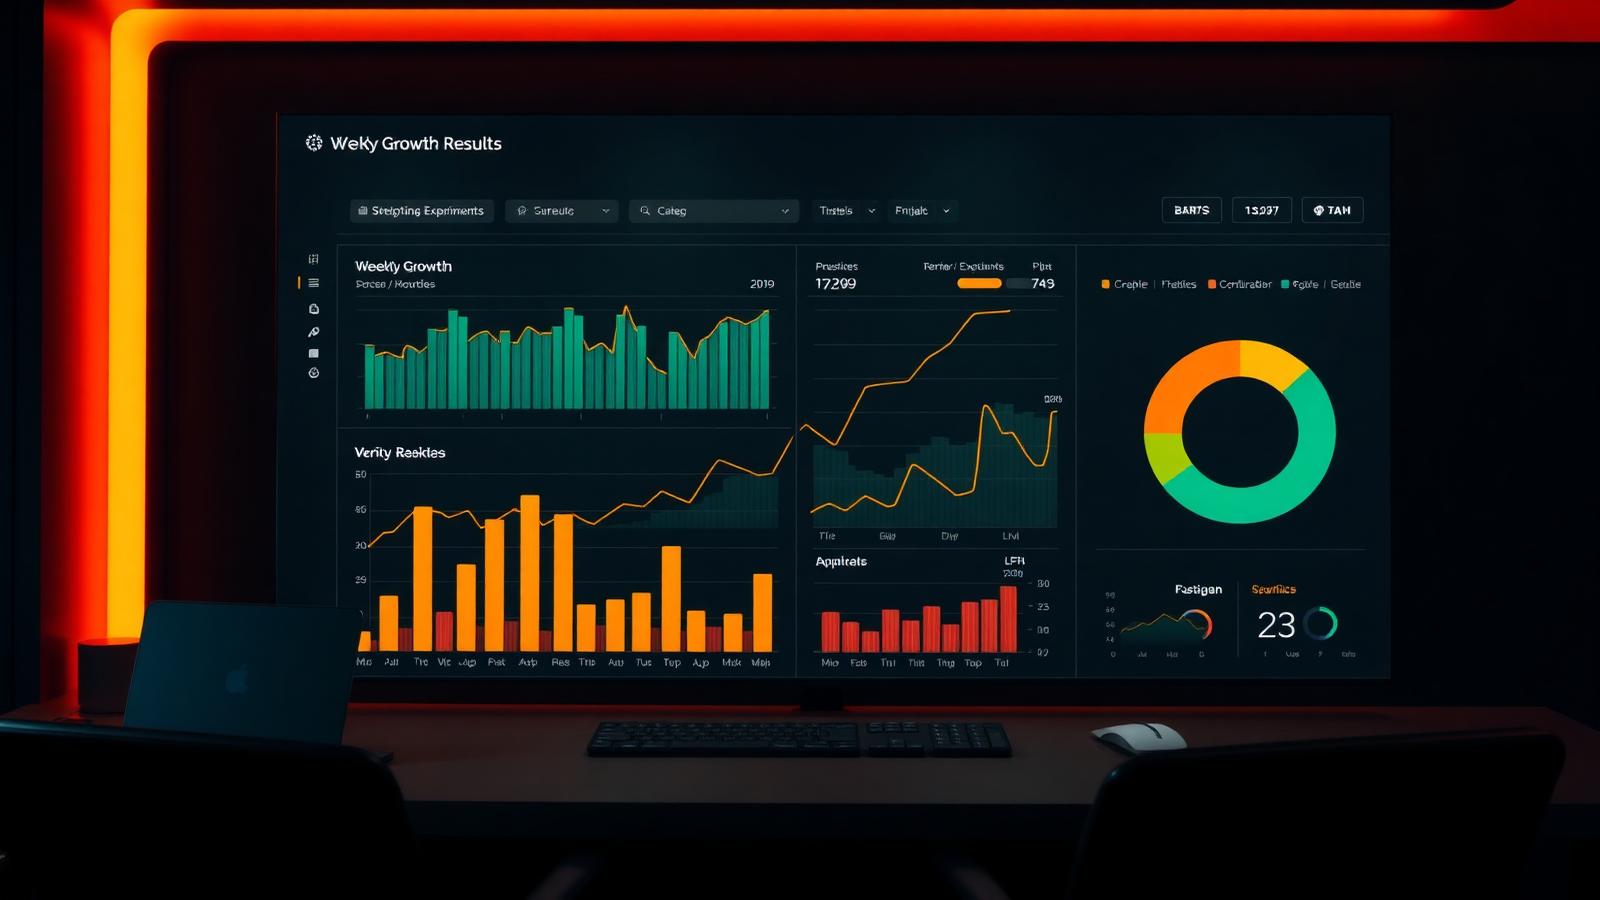
We build clear, actionable dashboards that answer one question: what generates revenue?
• Acquisition Dashboard: traffic by channel, cost per lead, conversion rate by source. You know exactly where to invest.
• Pipeline Dashboard: leads by stage, pipeline velocity, closing rate. Your sales team knows where to focus.
• ROI Dashboard: customer acquisition cost, LTV, LTV/CAC ratio by channel. Leadership makes decisions based on profitability, not impressions.
Our dashboards are powered by a solid data analytics infrastructure ensuring data reliability.
Continuous A/B testing
Every element of your growth strategy is testable:
• Landing pages: headlines, visuals, CTAs, social proof — each variant is tested with a statistically significant sample. • Emails: subject lines, content, send times, CTAs — nurturing sequences are continuously optimized. • Ads: creatives, audiences, bids — each campaign in your acquisition strategy is iterated weekly. • Conversion paths: each funnel step is optimized via our CRO approach.
No test without hypothesis. No deployment without statistical validation.
The weekly ritual
Every week, we follow a structured ritual:
1. Analysis (Monday): KPI review, anomaly identification, comparison with targets. 2. Hypotheses (Tuesday): test formulation based on observed data. 3. Execution (Wednesday-Thursday): test setup, campaign adjustments. 4. Measurement (Friday): initial results, learning documentation.
This rhythm guarantees continuous, measurable improvement — not PowerPoint reports nobody reads. It's the approach that distinguishes growth marketing from traditional marketing.
Our other Growth approaches
FAQ — Reporting & Iteration
Your questions about reporting and rapid iteration in growth marketing.